Thursday, April 26, 2012

NHL Norris Trophy - Statistical look at the last 3 years


The Norris trophy is an award handed out to the “defense player who demonstrates throughout the season the greatest all-round ability in the position” The voting is conducted by members of the professional hockey writer’s association. It is not at all based on stats, although this breakdown is. 

Shea Weber finds himself in among the nominee’s with familiar friend from the all star skill’s event, Zdeno Chara, and young Ottawa sensation Erik Karlsson. This is the second consecutive year for Weber and Chara.
Here is a Statistical breakdown of the last three years
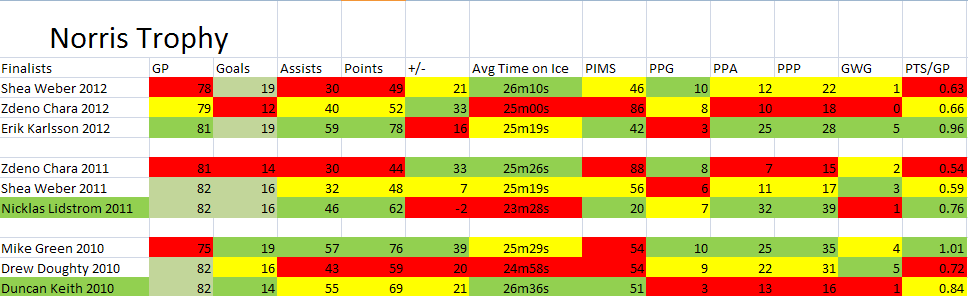
Stats that will help Weber:
-          Highest time on ice
-          Most Power Play Goals
-          Tied for most goals
-          Weber has improved in almost every statistic category since last year.

Stats that won’t help Weber
-          Lowest assist numbers
-          Lowest point total
-          Lowest Games Played

Other considerations

Statically, Erik Karlsson seems to be the clear favorite. He has an impressive .96 points per game with a mediocre +16 to boot. But, critics of Karlsson are quick to point out that he isn’t the best defensemen around. He is known for somewhat frequent mind lapses and poor position that lead to scoring chances. He also does not bring the physical game that Shea Weber is capable of. Chara leads the nominees in +/- but is last in ice time and has the highest penalty minutes.

Prediction (sort of)
Karlsson’s stats, although impressive, shouldn’t be enough to give him the trophy. In 2010 Mike Green averaged 1.01 point per game and he lost out to Duncan Keith (who lead nominee’s in Ice Time). Green did only play 75 games compared to Karlsson’s 81. None the less, Weber’s powerful point shot and physical defensive play will be enough to win him his first Norris trophy


Tuesday, April 24, 2012

2012 NHL Playoffs Western Semi Final 2 - Statistical Matchups

The Western Conference Semi Final features the Phoenix Coyotes vs the Nashville Predators. Below I present to you some statistics from their own 2011-2012 playoff series and from their regular season rendez-vous. But first, three key talking points.

1. Superstar goalies Mike Smith and Pekka Rinne  only met each other once this season, and it resulted in a 5-4 shootout win for Nashville

2. The home team lost every regular season game

3. The Preds Powerplay in the first round was striking at 9%, this will be matched with Phoenix's phenomenal penalty kill that killed off 18/19 Powerplays.

2012 NHL Playoffs Western Semi Final 1 - Statistical Matchups

The Western Conference Semi Final features the St. Louis Blues vs the Los Angeles Kings. Below I present to you some statistics from their own 2011-2012 playoff series and from their regular season rendez-vous. But first, three key talking points.

1. St. Louis has only scored one goal on Quick this season

2. Both teams are unbeaten on the Road in these playoffs.

3. St Louis dominated the power play in the first round, going 33% compared to LA's 11% conversion. St. Louis also had a stronger Penalty Kill.


Monday, April 23, 2012

NHL Playoffs Stats 1994-2011, Sweeps, Game seven's and more


Here is a somewhat oddly detailed chart of the playoffs since 1994. It focuses not on teams or players but games in the playoffs themselves. I picked 1994 because it was only after 94 that the NHL moved to the East and West divisions; Before it was a 4 division system which doesn’t cooperate well with my chart. Also 1994 is a long time ago so I thought it would be enough.

First some stats then the chart!

1)      4-9; The record of teams that have played less games than their opposition in the Stanley cup finals. Four times the teams have been tied (in games played) going into the finals.

2)      There were four Stanley Cup Final Sweeps in a Row from 95 – 98

3)      In 17 years, there has been only been one more Western Conference Game Playoff Game (west 679, East 678)

4)      But there have 5 more Western conference Series sweeps

5)      There is an average of 2 sweeps a year and 3.5 Game 7’s a year

6)      Home teams win 57% of game 7s, 

7)      But, in 2010 & 2011 Home teams were a shocking 20% in game 7s

8)      Excluding those years, Home teams are 64% in game 7s

9)      On average, there are 86 playoff games a year. 

10)  The high over 17 years for playoff games was 90, in 1994 and 2002.

11)  In 2007 there were only 80 games, the lowest in the 17 year span. Funnily, there was only one sweep that year. 

12)   2002 was the only year where there wasn’t a series sweep in the whole playoffs. 

13)  There has never been a post season without a game 7. 


Tuesday, April 10, 2012

"Moneyball'ing" the Eastern conference playoffs


So yesterday I did the Western Conference and today I present to you the East. Again the basic idea was to see which team has the most playoff goals scored by players currently on their roster (So Mario Lemieux’s goals for the Penguins don’t count, however Sergei Gonchar’s goals that he scored for teams across the league count for the Senators).

Also the goals per game stat is really dumb. The reason it’s so seemingly low is because it’s player’s goals per game and not team goals per game. Also in the case of Washington for instance there are 37 games counted 4 times (37 for Semin, 37 for Ovechkin ... all the same games) ... so really it’s an exceedingly meaningless stat. Do with it what you wish.

Again, here is the East Coast overall playoff stats for players currently on their roster.

And here is an in depth look at every teams individual performers. Thanks for the read!


Monday, April 9, 2012

“Moneyball-ing” The Western Conference Playoffs


So recently watched Moneyball... great movie. From what I understood, and maybe I got it wrong, but they tried to go after the guys with the most on bases. Get the most guys on base and you will win. Screw everything else, just get on base (from the movie, the book goes into crazy more detail).

So I thought I would do that with the West conference (the East will come next) ... but then it just got out of hand.

So, further below, is every player on your west coast playoff team roster’s playoff all-time playoff statistics. Make what you will with it. I’m not going to analyze them.

But first, the “Moneyball” analogy. Going simply by goals scored, the winner of the west coast is (Hold your breath it’s going to be a huge surprise) oh-shit it’s Detroit (wtf right!?). They have over 1500 goals! 491 more than second place San Jose!

But, this is a real sport and not baseball. This probably means absolutely nothing. Just like having the Predators leading the way in Playoff Goals per playoff games played also probably means nothing.

Anyway ... enough from me, venture into the statistics at your own will.


Friday, March 30, 2012

The Last Ten Games


So, my main goal in this was to see if there was any pattern to how teams performed in the last 10 games. If some teams stepped it up while others dropped the ball. I didn’t want individuals on teams to play a massive role. IE just going off of one year might have played too much testament to the players, and I wanted to try to distinguish it from organization to organization.

It was a bit difficult and I am not sure how well I did it. But what I went for was points earned in the last 10 games. Take that number and divide it by 20, the total points possible. So a team that goes 3-3-4 earns 50% of points possible. I then take this number, and compare the teams points over 72 games (So total season points – last 10 games). I divide this by 144 (82*2 = 164 (total points available in a season) – 20). This gives a % of points earned throughout the season. Subtract %2 from %1 and we see how many more or less points a team is earning in the last 10 games of a season. Make sense? Kind of at least?

The graph below contains your favourite NHL team so you can check them out. The top three most consistent are Chicago (.02 difference over 3 seasons), Vancouver (-.02) and Phoenix (.02).

Florida, Philadelphia and Colorado are the three least clutch teams, dropping the most points in the last 10 games compared to the season. The each earn 14, 17 and 21% less points (respectively) in the last 10 games compared to the season.

The winners in stepping it up for a playoff race (or ruining a draft chance) are Anaheim, Carolina and St-Louis with a positive difference of 15, 20 and 21% (respectively) in the last 10 games.

Make what you will of these stats. And feel free to discuss what you think of the accuracy of my formula (s) (suggest a better one!?)